Static code analysis in 3 steps
Background
In this post I’m going to show you how to setup SonarQube on Docker on Windows machine and the way how to perform a code analysis of simple application written in C#. Trust me, it’s easier than you think it is.
I would like to introduce SonarQube, which is an open source platform for continuous inspection of code quality. It could be built in Continous Integration (CI) process and perform code inspection in your projects during every build. It could be beneficial especially if you’re working on legacy projects. Even if you couldn’t add SonarQube to your CI process you still can check your code quality locally before you’ll push your code into repo. You can treat that as step zero before you’ll create a pull request which will be check by other team members.
SonarQube contains a lot of built in rules for various of languages like C#, Java, Javascript and others. Of course those rules can be modified or deleted/disabled. We can also add new custom rules dedicated for our project.
So let’s start!

Prerequirements
There is only one requirement which you need to meet before you can start. You must have Docker installed on your machine. If you don’t know what Docker is here is link to nice article which will introduce you in the subject.
If you have Docker installed you can skip this part. In other cases I encourage you to install it. Even if you’re thinking that it won’t be beneficial it could change in the future and you’ll be prepared :) Detailed installation instruction can be found on Docker’s official web site. For instance, if you’ve Windows installed on your machine is straightforward process. You need only to click “Next” button few times.
Here is link to hardware and software requirements from official documentation.
First step
Let’s check if we’ve Docker up and running on our local machine. To check this open PowerShell and run command docker --version. In my case result looks like below:
PS C:\Users\rapie2> docker --version
Docker version 17.09.1-ce, build 19e2cf6
Now we’re ready to set up and run of docker container based on SonarQube image. Hopefully SonarQube has its official repository on DockerHub so we can easily take latest docker image prepared by SonarQube. That will guarantee that everything should working out of the box. Now we need to write a command:
docker run -d --name sonarqube -p 9000:9000 -p 9092:9092 sonarqube
This command will download (if there is no image on local machine) latest version of SonarQube docker image from DockerHub, exposed TCP ports 9000 and 9092 (which are required by the tool to proper work), give container a name “sonarqube” and run it.
After an image is downloaded our container will be run. You can check if everything is working correctly by checking if container is working by passing command docker ps. Below example of this command result:
PS C:\Users\rapie2> docker ps
CONTAINER ID        IMAGE               COMMAND             CREATED             STATUS              PORTS                                            NAMES
c4f57f8c3ab5        sonarqube           "./bin/run.sh"      54 seconds ago      Up 51 seconds       0.0.0.0:9000->9000/tcp, 0.0.0.0:9092->9092/tcp   sonarqube
BTW if want to use this container in the future you need only to start existing container by running a command docker start sonarqube, where sonarqube is name of the container given during it creation (parameter –name).
We can go to http://localhost:9000/. SonarQube is working by default on port 9000. You should see site similar to this one:
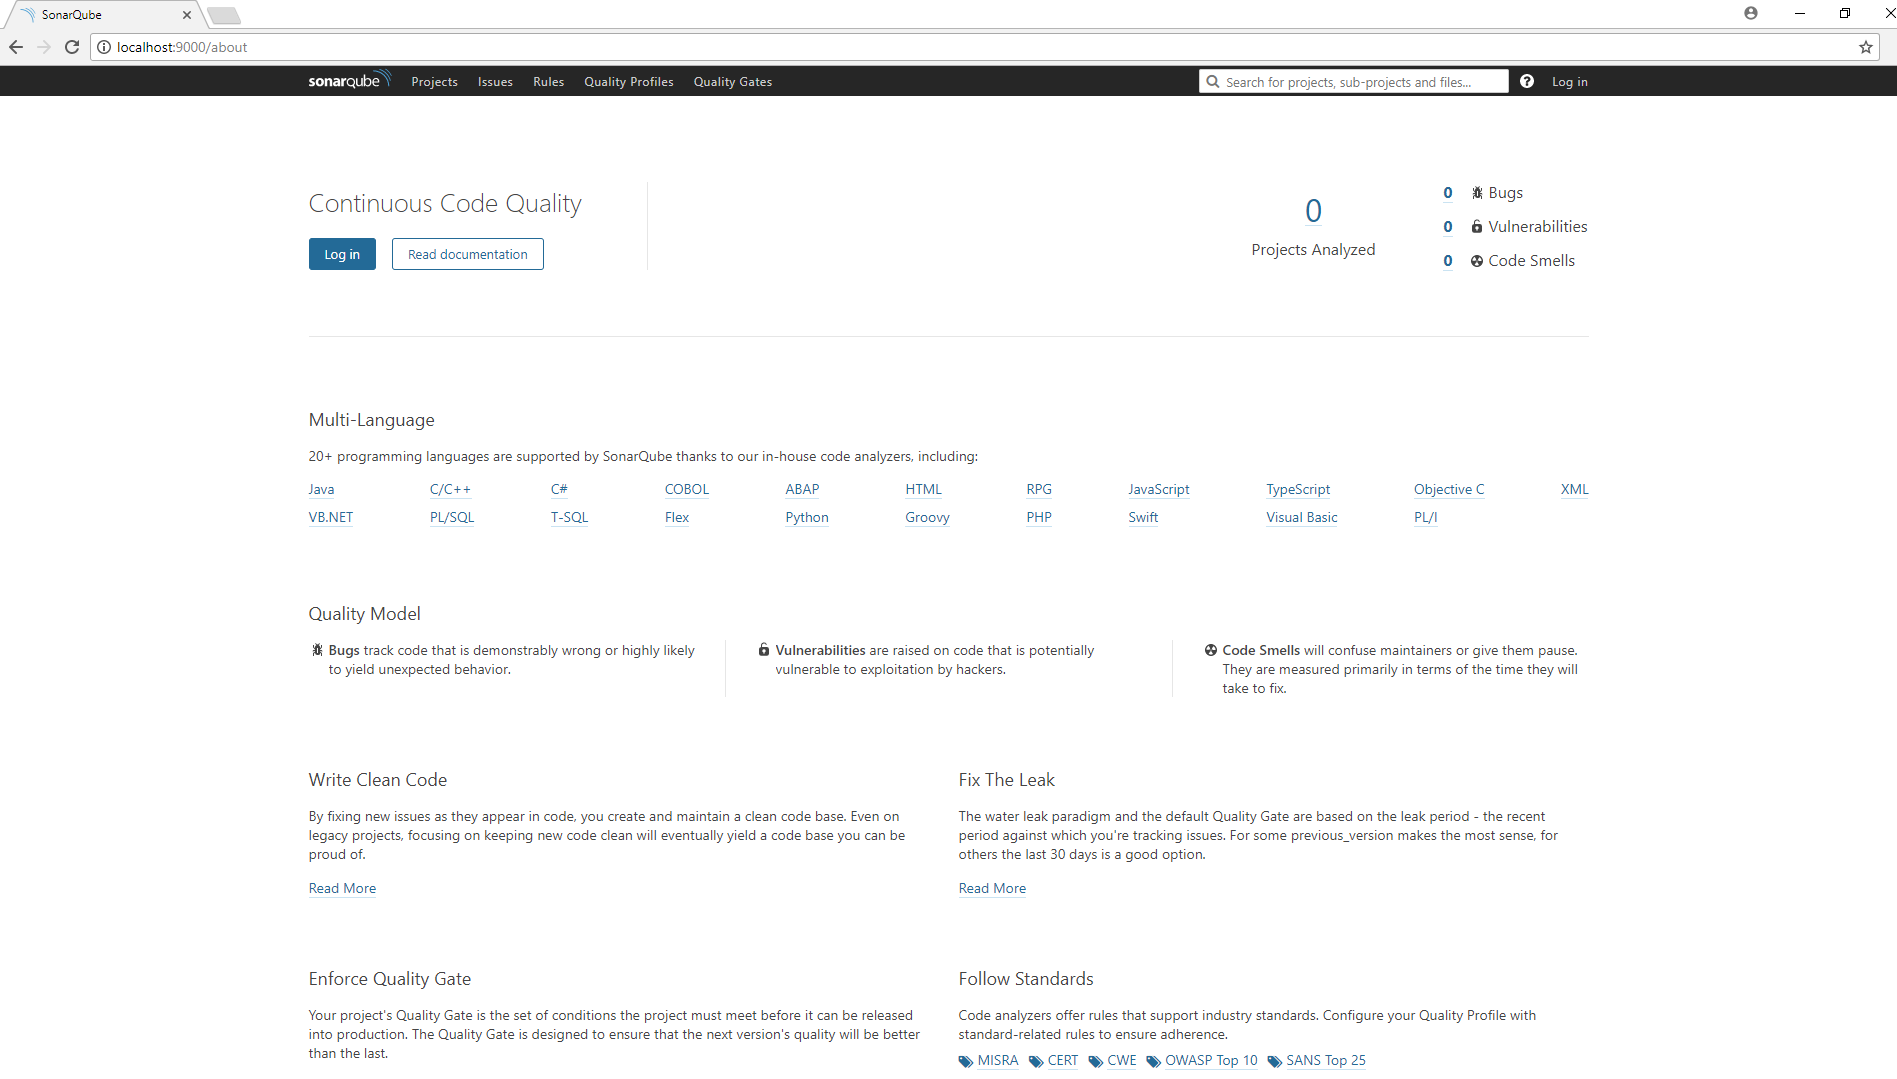
We’ve SonarQube up and running so we can go to the next step and set up our project.
Second step
In this step we’ll set up a .Net project written in C#. I’ve taken one from my projects on GitHub. Now we’ve our project so we need to login into SonarQube with default address http://localhost:9000/. Standard pair login/password is admin/admin. When we’ve been logged first time we’ll see nice welcome screen like this one:
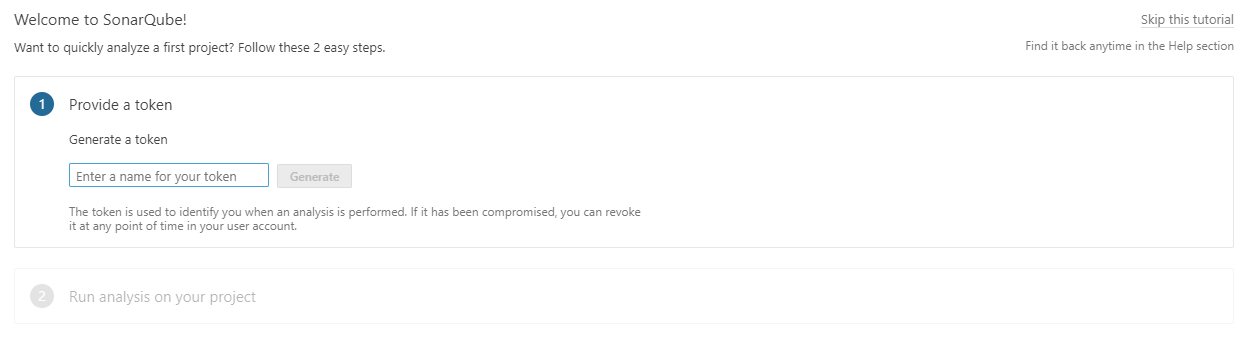
We need to generate a token which will be used to authentication. So let’s give them a name like MyKey. After that we will go to the next step. We should choos our project’s main language. In our case it’s C# or VB.NET. We will setup a unique project name. After that we well received steps which should be done to perform code analysis.
If you don’t have SonarQube client on your machine you need to install it first. In case of .Net application here is link to the client. Installation is an easy and straightforward process.
After you’ve installed SonarQube client you need to perform three simple instructions:
SonarQube.Scanner.MSBuild.exe begin /k:"MySuperProject" /d:sonar.host.url="http://localhost:9000" /d:sonar.login="44a669e52cf3f8fae8605268e1750a48d4d3f64a"

MsBuild.exe /t:Rebuild

SonarQube.Scanner.MSBuild.exe end /d:sonar.login="44a669e52cf3f8fae8605268e1750a48d4d3f64a"
First instruction will start analysis process. You need to set project’s name in our case MySuperProject, SonarQube’s host url http://localhost:9000 and SonarQube’s login which is token which we had generated earlier. Second instruction is standard rebuild operation from MsBuild. Last instruction informs SonarQube that process is ended.
After the process all gathered data will be sent to SonarQube server where they will be analysed. It could take some time depending of your solution size. When this process ends you can see results in SonarQube:
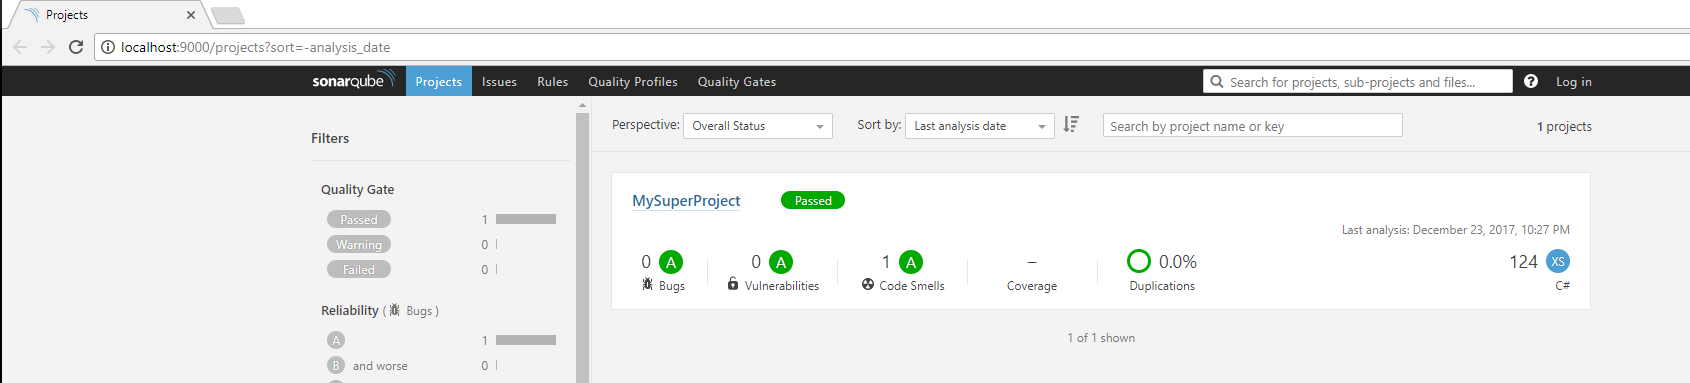
Thrid step
Third and last step in analysis of gathered data.

As you can see on screen above project description contains basic data about it like number of bugs, vulnerabilities, code smells, test coverage, code duplications percentage, number of lines of written code or main language.
We can see all of those operations on overview tab:
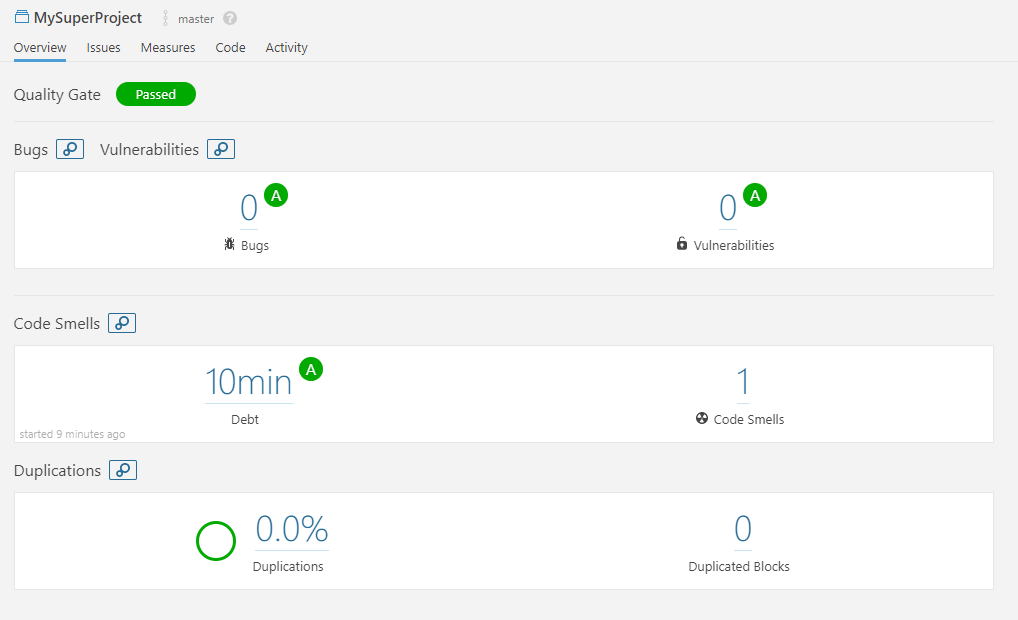
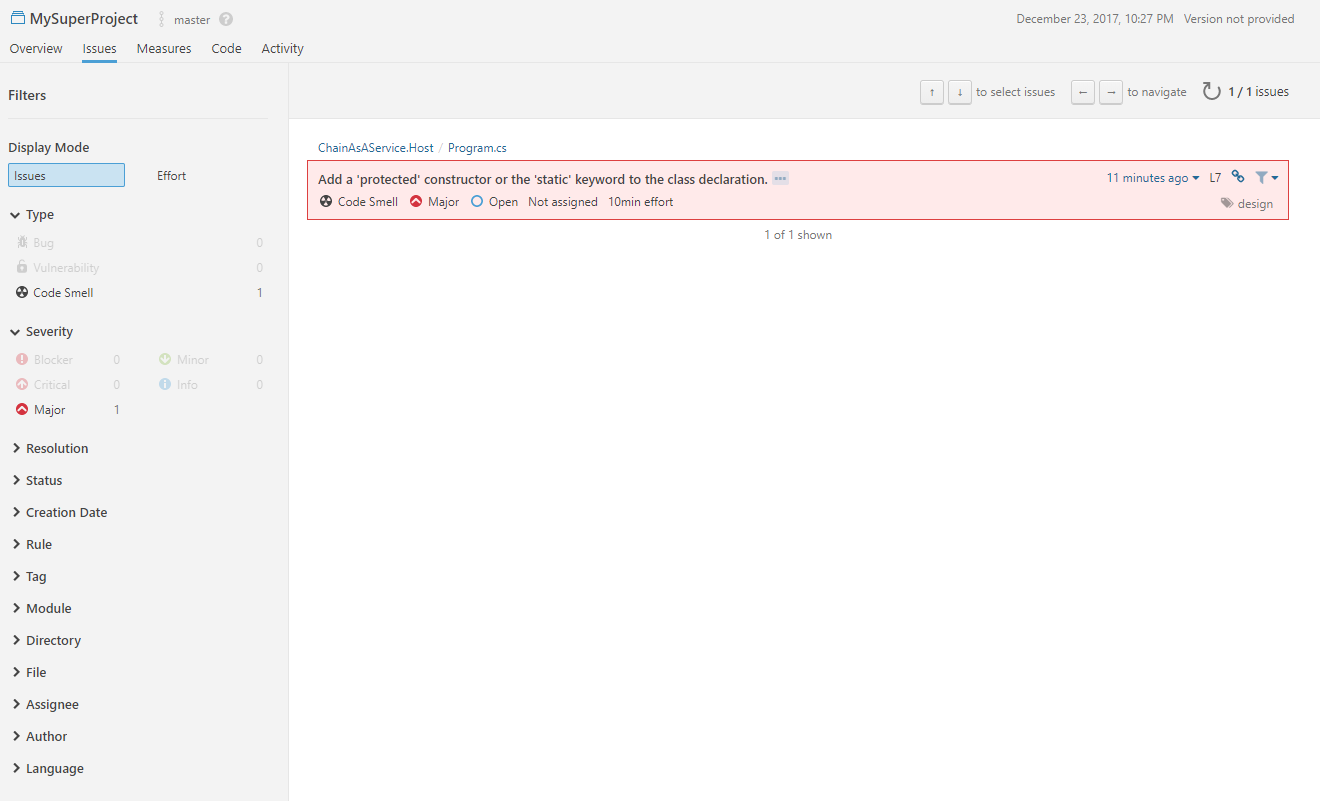
On Issues tab we can search through found issues. We can filter results by type, severity, creation date, language and many more options.
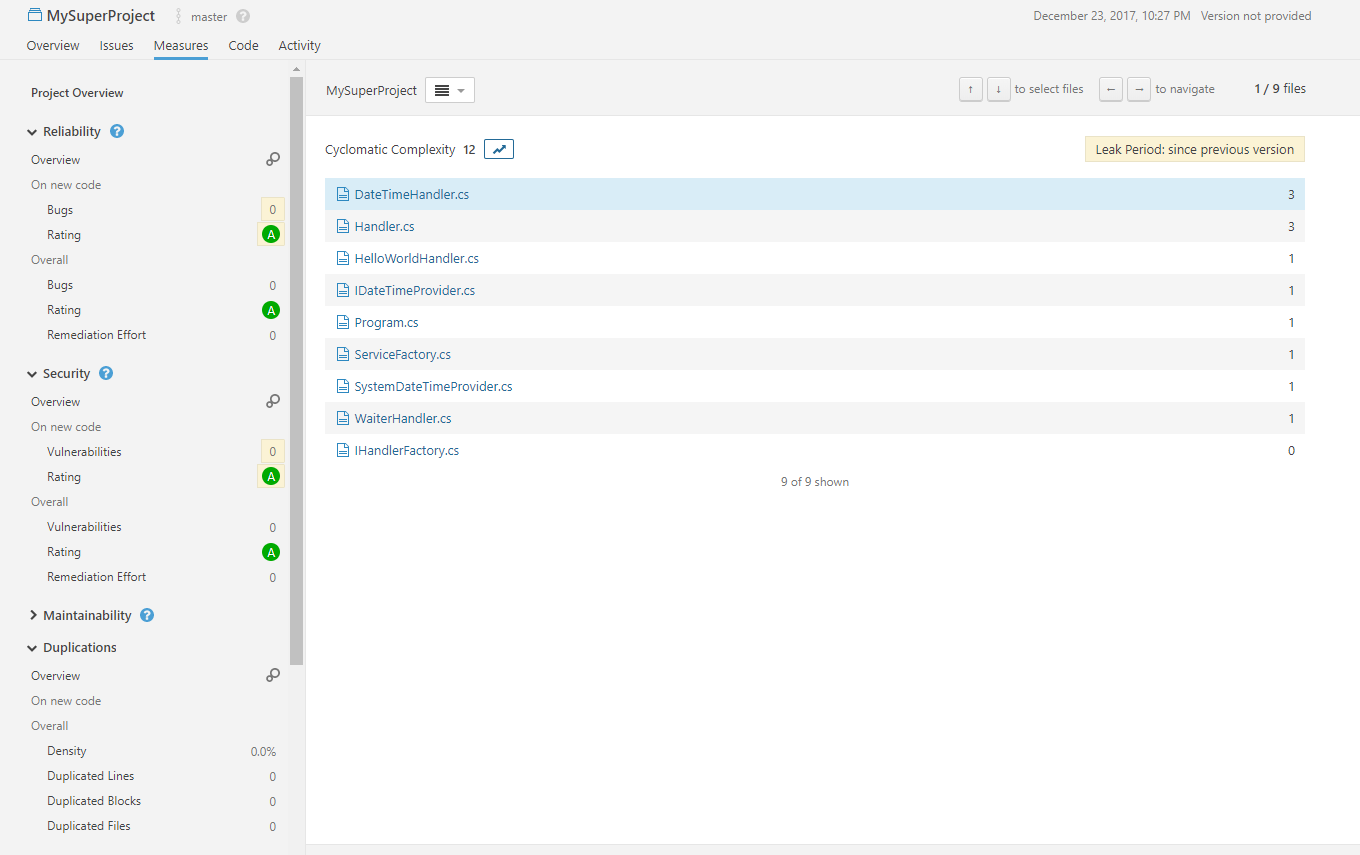
Measures tab contains detailed information about code analysis. It has been divided into few categories like Reliability, Security or Maintainability.
In my opinion Code tab is very useful. We can browse code and see if there are any problems in code.

In Activity tab we can see how number of code issues has changed over project’s lifetime.

Summary
I’ve introduced you a SonarQube platform. If you were thinking about perform code analysis I hope after lecture of this article you’ll do it. As you can see it’s simple to set up and perform code analysis. If you weren’t thinking about code analysis because you thought it’s hard to set up and perform I showed it isn’t.
If you consider other tool for code analysis use it. I encourage You to share your opinion about tool you’ve chosen in comment. I’m sure it’ll be beneficial for my and others. In my opinion it doesn’t matter which tool you’ll use but it matters that at the end of the day your code will be better and you’ll became a hero

Cheers.